タグmatplotlibを含む動画:4件 1ページ目を表示
2024年5月30日 06時22分に生成された05時00分のデータです
2021-10-23 13:05:02
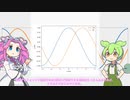
ずんだもんと四国めたんの matplotlib 簡単解説 1位
1位今回は1分ではありません。
以下に本動画で使用したコードを掲載します。
from pathlib import Path
import matplotlib.pyplot as plt
import numpy as np
def main():
fig, ax = plt.subplots()
x = np.linspace(
-np.pi,
np.pi,
1+360,
endpoint=True,
)
y1 = np.cos(x)
y2 = np.sin(x)
ax.plot(x, y1, label="cos")
ax.plot(x, y2, label="sin")
ax.set_xlabel("x axis")
ax.set_ylabel("y axis")
ax.set_xlim(-np.pi, np.pi)
ax.set_ylim(-1.1, 1.1)
ax.legend()
fig.tight_layout()
home = Path(__file__).resolve().parent
output = home.joinpath("wave_function.png")
fig.savefig(output)
plt.close(fig)
return None
if __name__ == "__main__":
main()動画の冒頭でこの図を出して、ソースコードのところで「ここの記述でグラフのここを指定する」みたいな解説の方が分かりやすいかも うぽつ pp は見たことありませんね... まれにppとする異端がいる
- 257
- 62.3
- 135.1
- 10.4
2014-02-04 23:24:13
matplot_colormaps_example 2位
2位matplotlibのcolormapsはカラーフィルターとして使えるかどうか。
colormapsの動くexampleとしては使えるのかも?
- python, matplotlib
- 元動画 -> sm15804110
- matplotlib colormaps example (http://matplotlib.org/examples/color/colormaps_reference.html)
- 動画から分割した画像のredをcolormapに
- 右のcolorbarの値が動くのはredが[min,max]=[0,255]ではないとき
- 感想:pastel1(#1:00)のcolormapが色を少し再現できたことには驚きました。その他のcolormapでもフィルターとして使えそうなものが2,3。1げと
- 221
- 10.5
- 00.0
- 20.9
2022-05-29 19:52:02
アリアルさんがmatplotlibを解説する!【ソフトウェアトーク理工サイド交流祭】 3位
3位アリアルさんがmatplotlibについて語ってくれるようです。
最後の多体問題のアニメーション:https://seiga.nicovideo.jp/seiga/im10966832
matplotlib wikipedia:https://ja.wikipedia.org/wiki/Matplotlib多体問題か おつかれ うぽつですわ
- 171
- 74.1
- 2112.3
- 10.6
2023-03-17 18:55:02
Python MIDI Visualization | MIDI可視化 (千本桜) 4位
4位Python : mido + matplotlib +imageio
MIDIから映像を作るプログラム
DAW画面の録画は退屈だし、MIDI Trailも飽きたので作ってみました。
ドラムの表示の元ネタはあの動画- 79
- 00.0
- 11.3
- 00.0